Dow Jones dives 375 points on rapid decline of U.S. economy

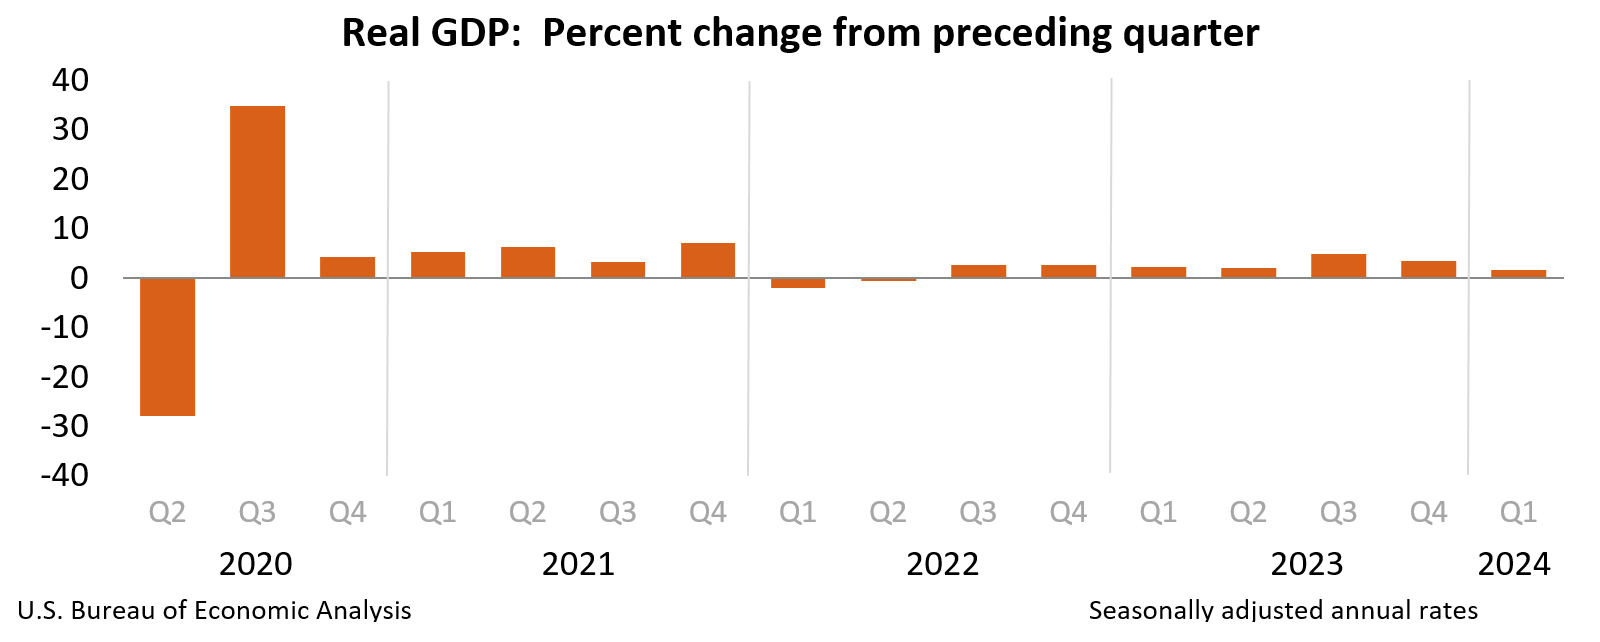
NEW YORK, New York — U.S. stocks plummeted Thursday on mixed, and contradictory economic data. While the U.S. economy, according to the U.S. Bureau of Economic Analysis, slowed in the first quarter, inflation surged. U.S. gross domestic product grew just 1.6 percent in the March quarter. Economists polled by Dow Jones revealed expectations of 2.4 percent GDP growth. The increase in real GDP primarily reflected increases in consumer spending, residential fixed investment, nonresidential fixed investment, and state and local government spending that were partly offset by a decrease in private inventory investment. Imports, which are a subtraction in the calculation of GDP, a statement issued by the Bureau of Economic Analysis on Thursday said. The full statement follows our U.S. and Global Markets reports below. "In the short term, the numbers don’t appear to be a green light for either bulls or bears...the uncertainty is unlikely to ease pressures in a market experiencing its deepest pullback since last year," Chris Larkin, managing director of trading and investing at E*Trade from Morgan Stanley told CNBC Thursday. By the closing bell, the stock market witnessed a sell-offs across major indexes. While the S&P 500 and NASDAQ Composite saw marginal dips, the Dow Jones Industrial Average experienced a more pronounced decline. The S&P 500 (^GSPC) closed at 5,048.41, marking a decrease of 23.22 points. This represents a decline of 0.46 percent. Trading volume for the S&P 500 stood at approximately 2.636 billion shares. The Dow Jones Industrial Average (^DJI) concluded the day at 38,085.80, reflecting a substantial drop of 375.12 points, or 0.98 percent. Trading activity for the Dow Jones was recorded at 402.126 million shares. The NASDAQ Composite (^IXIC) wrapped up Thursday’s session at 15,611.76, down 100.99 points, translating to a decline of 0.64 percent. Trading volume for the NASDAQ reached around 4.093 billion shares. World Foreign Exchange Market: U.S. Dollar Dives on 1st Quarter GDP Relapse, Inflation Surge In the bustling realm of international finance, Thursday’s foreign exchange (forex) market was volatile with the greenback being publed by the March quarter’s slowdown in the economy, coupled by a spike in inflation. Here are the latest updates for Thursday, approaching the U.S. close: EURUSD (Euro / US Dollar): USDJPY (US Dollar / Japanese Yen): USDCAD (US Dollar / Canadian Dollar): GBPUSD (British Pound / US Dollar): USDCHF (US Dollar / Swiss Franc): AUDUSD (Australian Dollar / US Dollar): NZDUSD (New Zealand Dollar / US Dollar): In summary, Thursday’s forex market depicted decent gains across major currency pairs, with the exception of the yen, underscoring the intricate interplay of economic variables and geopolitical developments influencing global financial landscapes. Global Markets Close Thursday with Major Falls In Europe and Asia In the latest trading session, global markets witnessed serious sell-offs on Thursday not only ni the United States but across Europe and Asia, as well as Egypt. Japan’s Nikkei 225 fell ore than 800 points. The worst performing bourse however was Cairo’s with the Egyptian exchange losing more than 3 percent. Here’s a roundup of the closing stock market quotes of the world’s non-U.S. indices: CANADA On the bright side, the S&P/TSX Composite index (^GSPTSE) managed to buck the trend, closing at 21,885.38. This indicates a slight uptick of 11.66 points, or 0.05 percent. Trading volume for the S&P/TSX Composite index was noted at 214.703 million shares. UNITED KINGDOM FTSE 100 (UK): The FTSE 100 in London closed at 8,078.86, marking an increase of 38.48 points, equivalent to a rise of 0.48 percent. EUROPE DAX PERFORMANCE-INDEX (Germany): The German DAX PERFORMANCE-INDEX concluded at 17,917.28, registering a decrease of 171.42 points, equivalent to a decline of 0.95 percent. CAC 40 (France): France’s CAC 40 index settled at 8,016.65, marking a decline of 75.21 points, equivalent to a decrease of 0.93 percent. ASIA Nikkei 225 (Japan): In Tokyo, the Nikkei 225 index closed at 37,628.48 Thursday, experiencing a drop of 831.60 points, equivalent to a decline of 2.16 percent. HANG SENG INDEX (Hong Kong): The HANG SENG INDEX in Hong Kong concluded at 17,284.54, with an increase of 83.27 points, equivalent to a rise of 0.48 percent. SSE Composite Index (China): China’s SSE Composite Index stood at 3,052.90, marking a rise of 8.08 points, equivalent to an increase of 0.27 percent. Shenzhen Index (China): The Shenzhen Index closed Thursday at 9,264.48, experiencing an uptick of 13.35 points, equivalent to a rise of 0.14 percent. OCEANIA Stock markets in the major corners of Oceania were closed on Thursday as Australia and New Zealand observed the annual Anzac Day commemoration in rememberance of their fallen soldiers in past wars. S&P/ASX 200 (Australia): On Wednesday, Australia’s S&P/ASX 200 settled at 7,683.00, showing a marginal decrease of 0.50 points, equivalent to a decline of 0.01 percent. ALL ORDINARIES (Australia): Australia’s ALL ORDINARIES index stood at 7,937.50 Wednesday ahead of Anzac Day, showing a marginal decrease of 0.40 points, equivalent to a decline of 0.01 percent. S&P/NZX 50 INDEX GROSS (New Zealand): New Zealand’s S&P/NZX 50 INDEX GROSS closed at 11,946.43 on Wednesday, marking an increase of 143.15 points, equivalent to a rise of 1.21 percent. AFRICA Top 40 USD Net TRI Index (South Africa): South Africa’s Top 40 USD Net TRI Index on Thursday closed at 3,859.70, with an increase of 27.51 points, equivalent to a rise of 0.72 percent. ESTX 50 PR.EUR (Europe): The ESTX 50 PR.EUR concluded at 4,939.01, marking a decrease of 50.87 points, equivalent to a decline of 1.02 percent. Euronext 100 Index (Europe): The Euronext 100 Index settled at 1,504.93, showing a decline of 10.84 points, equivalent to a decrease of 0.72 percent. BEL 20 (Belgium): Belgium’s BEL 20 index stood at 3,857.94 Thursday, experiencing a drop of 25.89 points, equivalent to a decline of 0.67 percent. STI Index (Singapore): Singapore’s STI Index settled at 3,287.75, marking a decrease of 5.38 points, equivalent to a decline of 0.16 percent. S&P BSE SENSEX (India): India’s S&P BSE SENSEX closed at 74,339.44, with an increase of 486.50 points, equivalent to a rise of 0.66 percent. NIFTY 50 (India): India’s NIFTY 50 closed at 22,570.35, marking an increase of 167.95 points, equivalent to a rise of 0.75 percent. IDX COMPOSITE (Indonesia): Indonesia’s IDX COMPOSITE on Thursday concluded at 7,155.29, experiencing a drop of 19.24 points, equivalent to a decline of 0.27 percent. FTSE Bursa Malaysia KLCI (Malaysia): Malaysia’s FTSE Bursa Malaysia KLCI stood at 1,569.25, showing a decrease of 2.23 points, equivalent to a decline of 0.14 percent. KOSPI Composite Index (South Korea): South Korea’s KOSPI Composite Index concluded at 2,628.62, with a decrease of 47.13 points, equivalent to a decline of 1.76 percent. TSEC weighted index (Taiwan): Taiwan’s TSEC weighted index stood at 19,857.42, experiencing a drop of 274.32 points, equivalent to a decline of 1.36 percent. MIDDLE EAST TA-125 (Israel): Israel’s TA-125 index on Thursday closed at 1,948.36, showing a decrease of 13.87 points, equivalent to a decline of 0.71 percent. EGX 30 Price Return Index (Egypt): Egypt’s EGX 30 Price Return Index settled at 25,917.60, with a significant decrease of 859.40 points, equivalent to a decline of 3.21 percent. The global market performance was influenced by various factors including geopolitical tensions, economic indicators, and corporate earnings reports. Investors are closely monitoring developments in key sectors and regions as they assess market trends and opportunities. Following is the full statement by the U.S. Bureau of Economic Analysis on the first quarter’s GDP data: Real gross domestic product (GDP) increased at an annual rate of 1.6 percent in the first quarter of 2024 (table 1), according to the "advance" estimate released by the Bureau of Economic Analysis. In the fourth quarter of 2023, real GDP increased 3.4 percent. The GDP estimate released today is based on source data that are incomplete or subject to further revision by the source agency (refer to "Source Data for the Advance Estimate" on page 3). The "second" estimate for the first quarter, based on more complete source data, will be released on May 30, 2024. The increase in real GDP primarily reflected increases in consumer spending, residential fixed investment, nonresidential fixed investment, and state and local government spending that were partly offset by a decrease in private inventory investment. Imports, which are a subtraction in the calculation of GDP, increased (table 2). The increase in consumer spending reflected an increase in services that was partly offset by a decrease in goods. Within services, the increase primarily reflected increases in health care as well as financial services and insurance. Within goods, the decrease primarily reflected decreases in motor vehicles and parts as well as gasoline and other energy goods. Within residential fixed investment, the increase was led by brokers’ commissions and other ownership transfer costs as well as new single-family housing construction. The increase in nonresidential fixed investment mainly reflected an increase in intellectual property products. The increase in state and local government spending reflected an increase in compensation of state and local government employees. The decrease in inventory investment primarily reflected decreases in wholesale trade and manufacturing. Within imports, the increase reflected increases in both goods and services. Compared to the fourth quarter, the deceleration in real GDP in the first quarter primarily reflected decelerations in consumer spending, exports, and state and local government spending and a downturn in federal government spending. These movements were partly offset by an acceleration in residential fixed investment. Imports accelerated. Currentdollar GDP increased 4.8 percent at an annual rate, or $327.5 billion, in the first quarter to a level of $28.28 trillion. In the fourth quarter, GDP increased 5.1 percent, or $346.9 billion (tables 1 and 3). The price index for gross domestic purchases increased 3.1 percent in the first quarter, compared with an increase of 1.9 percent in the fourth quarter (table 4). The personal consumption expenditures (PCE) price index increased 3.4 percent, compared with an increase of 1.8 percent. Excluding food and energy prices, the PCE price index increased 3.7 percent, compared with an increase of 2.0 percent. Personal Income Current-dollar personal income increased $407.1 billion in the first quarter, compared with an increase of $230.2 billion in the fourth quarter. The increase primarily reflected increases in compensation and personal current transfer receipts (table 8). Disposable personal income increased $226.2 billion, or 4.5 percent, in the first quarter, compared with an increase of $190.4 billion, or 3.8 percent, in the fourth quarter. Increases in compensation and personal current transfer receipts were partly offset by an increase in personal current taxes, which are a subtraction in the calculation of DPI. Real disposable personal income increased 1.1 percent, compared with an increase of 2.0 percent. Personal saving was $755.7 billion in the first quarter, compared with $815.5 billion in the fourth quarter. The personal saving rate-personal saving as a percentage of disposable personal income-was 3.6 percent in the first quarter, compared with 4.0 percent in the fourth quarter. Source Data for the Advance Estimate The GDP estimate released today is based on source data that are incomplete or subject to further revision by the source agency. Information on the source data and key assumptions used in the advance estimate is provided in a Technical Note and a detailed "Key Source Data and Assumptions" file posted with the release. The second estimate for the first quarter, based on more complete data, will be released on May 30, 2024.
The euro edged up against the dollar by 0.30 percent, with the exchange rate resting at 1.0730. European markets held steady amidst economic recalibrations.
The Japanese yen, bucking the trend, continued its downward spiral to record territory, sliding to 155.57 yen.
The Canadian dollar, advanced 0.32 percent. The exchange rate stood at 1.3658 around Thursday’s close, reflecting nuanced shifts in North American trade dynamics.
The British Pound exhibited resilience, climbing by 0.43 percent against the dollar. The exchange rate reached 1.2517, signaling potential market sentiment shifts amidst UK economic developments.
In a mirror image of the USDCAD trend, the U.S. Dollar depreciated by 0.32 percent against the Swiss Franc, landing at 0.9120. Investors monitored geopolitical factors influencing the Swiss currency’s performance.
The Australian Dollar saw a modest uptick of 0.31 percent against the greenback, with the exchange rate standing at 0.6517 Thursday. Market participants navigated through evolving commodity prices and regional economic data.
Finally, the New Zealand Dollar strengthened by 0.22 percent versus the dollar, reaching 0.5949. Investors maintained a watchful eye on global trade dynamics and domestic economic indicators.Gross Domestic Product, First Quarter 2024 (Advance Estimate)